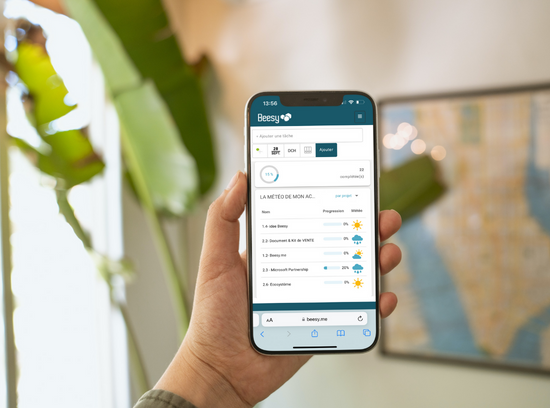
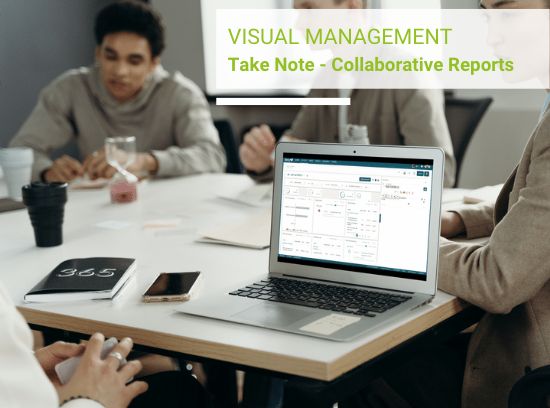
6 TIPS to create a successful reporting

January 25, 2022

Click to rate this post!
[Total: 1 Average: 5]

Information overload : management tools, Business Intelligence tools, CRM, emails… It is not the data that is missing!

But the real challenge today is to be able to use all this information wisely to help teams manage their activity and track their strategy plan.

Reporting seems to be the right TOOL to give sense to data to make the right decisions.

To make it a truly attractive tool used by all the teams, here are a few tips to implement your reports and engage the team.

What is a report?

Reporting is  a document that present in a clear way data centralized and collected over a specific and recurring period that can be analyzed and used by teams.

The goal is therefore clearly that teams can easily see and understand data and information with a synthetic and visual vision, to facilitate decision-making .

Reporting is a real tool to support teams in managing and measuring their activity performance.


New dashboard -

Why do we need to do Reporting ?

Reporting is a real asset for a company. Far from serving as a “control” tool, it essentially aims to meet the following objectives :

  • To be analyzed for strategic decision making
  • Evaluate the collective performance on projects or goals
  • To guide managers and teams in achieving their goals by quickly highlighting potential risks
  • Unify communication and provide insight into goal progress
  • Transmit strategic or operational information within and accross departments
  • Share objectives and give more meaning to the work to employees who can see the progress of their work and participation in collective objectives
Reporting structures data in a clear and accessible way.  It displays information in various representations to make its content more actionable.
Its format and frequency depends on organization, managers and teams needs. Reporting interest and use also varies by user :
  • The manager – to evaluate the Teams performance and make decisions based on objective justifications
  • The team member – to easily track his work progress and priorities against objectives
  • The management team – to refine strategy and identify major risks
  • The executive team – to have KPIs for business performance
Thus, far from being a means of “accountability”, reporting is useful to the entire organization, to the hierarchy, which is thus kept informed of progress, but also to the teams, which can extract analyses and lessons for their activities.
In any case, no matter who uses the reporting, they must be able to understand the data and analyze the situation at a glance without further processing, otherwise the reporting loses its interest.
The analysis of the reports must lead to actions plan and concrete questions (“what happened? Why? what decisions should we make? what are the next steps? …) on the results.
Reporting is thus a valuable tool to master goal realisation

How to build your reporting ?

Reporting is built in 3 essential steps:

Steps to create a reporting -

6 tips to implement your reporting


Tip #1 – Using Reporting to achieve a goal

This first step is one of the most important in the process. To be truly effective, reporting cannot be improvised.
To be honest, figures and chart analysis is not always easy to digest, and even more so if it is not adapted to your target’s needs.
9

Quality and useful reporting to teams begins with a reflection on its goal.

A reporting without precise objective that does not answer a request will be a nth unread email in mailbox.
Your reporting should contain the information you want for 1 goal and 1 target. To choose your indicators, you should also define your target audience.
The 3 fundamental questions to ask are:
  • What goals do you want to drive with the report? (Ex: Master the Customer project deadline Increase sales in a region…)
  • Who is this reporting for?  Your team?  to The Management? To other business units?
  • How will your Team use it?

For example, if your reporting is for a specific project, you need to define the project group’s member objectives and the needs upstream to ensure that the objective is being met, and thus establish indicators to track these elements. Don’t hesitate to involve the team in setting goals to increase the commitment and usefulness of your reporting to your organization.


Tip #2 – The right frequency

To succeed in reporting, it is necessary to specify the period over which the data must be collected: over a week, a month,a quarter or even a year…
To choose the right frequency answer the following question:

When will the observed performance allow you to take action?

The reporting frequency is therefore dependent on its purpose. The different frequencies give you distinct benefits.
  • Weekly: a report every week to follow up on a team activity, on the project performance for more operational monitoring.
  • Monthly: for a more trend-increasing objective, the figures and performances of last month and  to quickly identify the improvement points for next month.
  • Quarterly: this is the ideal interval for a thorough analysis of the strategy and, an interesting help in setting strategic objectives.  The same applies to a half-yearly or annual report.

    Good to know:

    It is important for monthly reports to have notions of evolution over time and to be able to make comparisons with the previous report.

    Tip #3  Indicators useful for big picture and decision making

    Include only indicators that can trigger targeted actions and facilitate decision-making. Any other indicators are superfluous

    9

    Clear and concise are the watchwords in choosing your key indicators!

    Too much reporting, kills reporting. This tool, which is essential for driving, can be double-edged. With information overload, we quickly tend to want more KPIs, more and more reporting, the reports become heavy, and too detailed, and basically useless because we no longer know which one is relevant and why? Beware of the time spent to build them but also and especially to analyze and understand them.

    To sum-up : straight to the point!

    To make your reporting easier to read, choose the following rule :

    9

    Do not exceed 1 slide reports for 1 objective.

    Always in the interest of clarity, avoid going into every conceivable KPIs. Focus on thoses that make the most sense, including:

    • Those that measure concrete results;
    • A few indicators that allow you to track achievement in order to assess progress trends;
    • A comments and recommendations box for next steps can also be a nice to have in your reports.

      Don’t forget just actionable Indicators !


      Tip #4 – Save time by automating the collect of relevant and, most importantly, up-to-date data

      Once you have defined your report indicators, it is important to define how to collect the data.

      Reporting is data-driven: access but also and above all the quality of it.

      It can come from manually entered data but also from business or operational tools.

      As far as possible, the best way to access the most relevant data possible is to automate data collection.  Avoid manual input and processing to ensure that reporting is the latest version with up-to-date real-time data.

      Keep manual input for feedback and action plan proposal

      To ensure data quality, you can ask yourself the following 3 questions:

      Reliability: how can be sure that my collected data is accurate and up to date?

      Format :  Is the data collected format uniform accross all indicators?

      Calculation: Do I need to do some calculation to make the information usable?

      Automating data collect and anlysys can help you aggregate the data to make it more reliable and understandable: it also saves time in creating the data and guarantees its reliability.

      You still have to make sure that your business tools are up to date…

      Tip #5 – Don’t skimp on form for attractive reporting

      Make it easy to read and analyze with visuals and graphics.

      9

      Your reporting must be pleasant to read, both in terms of content with relevant indicators and in terms of form with visuals, graphics and colors.

      Some tips

      • Add color, but not too much either, to avoid the Christmas tree effect. Color should be used to highlight some important data, or to symbolize in 1 simple glance, a status.
      • To facilitate the interpretation by your team, use your graphic chart color. This also allows a homogeneous interpretation of the colors on all the reports.
      • Prioritize your information for easy reading
      • Use visuals both to make you report less dense and to catch the reader’s eye: For example, for a customer reporting, use thier logo.
      • Use the appropriate graphics to highlight your information and message

      Choose the right format according to your needs:

      different type of graphics -

      Tips #6 – Communicate and share

      Reporting is a useful tool for your entire organization. Its communication should not be limited to the hierarchy but also be used to motivate teams.

      The communication and sharing allows you to guarantee a homogeneous information on goals achievement within you team but also to maintain the collective dynamics. It also has the advantage of standardizing the way your team manages its activities by making them all look and move in the same direction.

      Choose the right way to communicate according to your targer :

      • E-mail rather for your hierarchy or decision-making committee  the goal is to DECIDE. Don’t forget to include a synthesis and action plan comments on your email
      • A collaborative tool – The goal is ACTION. Teams can interact in real time with the dashboard for more in-depth analysis and act accordingly

      The interactivity can be an important asset for the dasboard success. Teams should easily identify how to act to improve results and performance: Indicators for actionable decisions.

      An interactive report should allow teams to perform various types of more in-depth analysis of data in realtime, such as clicking to access more specific information.

      Feedback is an important point to know how your teams member understant the message and can use the reports in their daily work. This feedback also allows you to develop your dashboards to improve your collaborative performance.


      In short, for reporting to be a real driving tool

      Do

      • Useful reporting: well thought-out KPIs for an objective and a target
      • Concise reporting: Only key indicators
      • Pleasant to read: with the right illustrations and visuals
      • Contextualize with captions and comments
      • Make it interactive to be in actionable mode
      • Share with teams: teams concerned by the reporting
      • A decision-making tool, not a purpose in itself
      • Scale it to meet your Team needs and feedback
      • Always up-to-date reports: Make sure your reports are up to date, otherwise they will be redundant and obsolete. 

      Don't do

      • Create a report without asking yourself questions about its purpose

      • Choose indicators that are difficult to update with each report

      • Track only those indicators that are easy to measure and do not allow you to evaluate the true performance of your business

      • Overload your reporting with too much data

      • Bore your target with static presentations

      • See it as a control tool and not a decision-making tool

      • Never question your KPI : perfect reporting does not exist, it needs to evolve with needs and expectations

      • Don’t email your dashboards without explanation or context.

      logo Beesy transparent Teams 150x150 1 -

      The solution for your tailor-made operational activity reports

      • You build your customized reports
      • Beesy consolidates all you activity action plan from meetings, emails and chat
      • Automated real-time reporting
      • Interactive reports for detailed analysis of indicators
      • Shared reporting to energize and motivate teams
      • Visual and graphic reports

      To conclude,

      Reporting is a relevant tool to help a company, department or employee achieve their goals. This at-a-glance view of limied KPI panel allows you to get to the point, facilitate the communication, gather teams around the same objectives and above all make the right decisions. It allows users to gain perspective a look at the activity. Thanks to its conciseness and its evolution, it allows anticipation and collaboration.

      Join our 60 000 users

      who improve their activity management with Beesy


      Click to rate this post!
      [Total: 1 Average: 5]

      You May Also Like…

      The key factors for a successful one-on-one meeting

      The key factors for a successful one-on-one meeting

      One-on-one meeting is a powerful management tool. It allows to take stock with your collaborator and establish clear objectives to be achieved in order to increase his productivity and efficiency. Each meeting should be prepared in the morning while you're organizing...

      Lead and animate your meetings in AGILE mode

      Lead and animate your meetings in AGILE mode

      If meeting is all about stress, boredom, or wasted time for you, then now is the time to take action. Opt for the agile method to boost your meetings, meet your deadlines and above all think CO-LLE-CTIFA-G-I-L-E is the buzz word in most businesses. But in summary what...

      Contacteznotre équipe commerciale